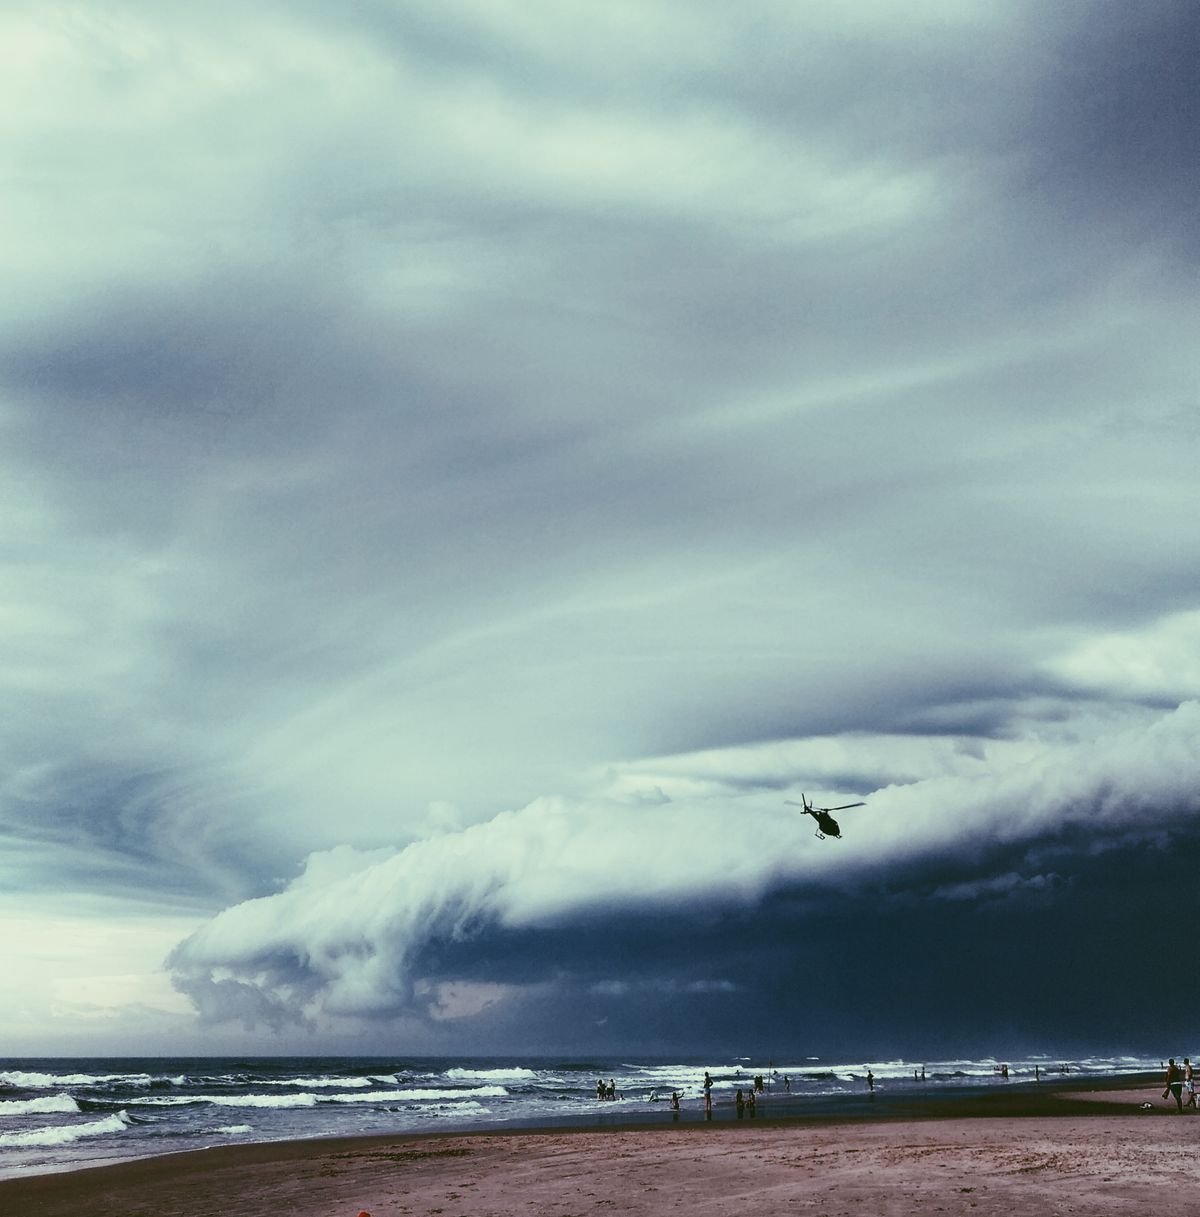
There is a river in the sky above your head right now. It carries more water than the Amazon, but you cannot see it. It controls whether your state is in drought or flood. It is called an atmospheric river, and on December 22, 2010, it had already delivered 75 percent of California’s entire annual snowpack before winter even officially began. Reservoirs filled. Ski resorts opened early. The source of all that water was invisible. It stretched thousands of miles across the Pacific Ocean, a narrow ribbon of moisture carrying more water than the Mississippi River. It was an atmospheric river, and it had just saved California from another dry year. The same phenomenon, on a different day, can drown a town. On New Year’s Day 1997, an atmospheric river parked itself over Northern California for 100 hours. It dropped enough rain to cause more than a billion dollars in damage. Rivers jumped their banks. Hillsides liquefied into mud. The storm killed people. Atmospheric rivers explained simply come down to this: the same weather system delivers half of your water and nearly all of your flood risk. Understanding them, as millions of people on the West Coast now do every winter when forecasts flash “AR event incoming,” means understanding why California swings violently between not enough water and way too much.
Atmospheric Rivers Explained: The Fire Hose in the Sky
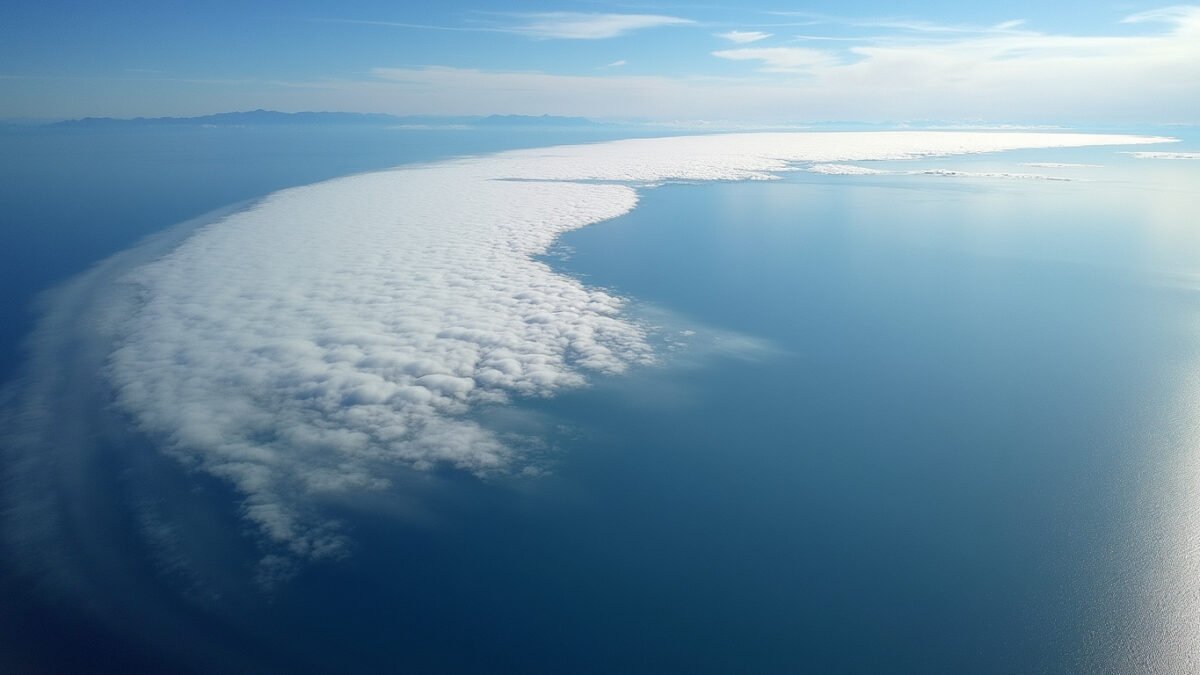
What is an atmospheric river? It is a narrow corridor of concentrated water vapor in the sky, typically thousands of kilometers long but only a few hundred kilometers wide. Think of it as a fire hose pointed at a coastline. The hose is invisible because water vapor is transparent. The effects are anything but. A single strong atmospheric river can transport more water than the Amazon River, according to NOAA. The average AR moves water vapor roughly equal to the flow at the mouth of the Mississippi. Exceptionally strong ones can carry up to 15 times that amount. These rivers in the sky account for over 90 percent of all north-south water vapor movement on Earth while covering less than 10 percent of any given latitude band. They are nature’s most efficient water delivery system. Scientists at the Center for Western Weather and Water Extremes at Scripps Institution of Oceanography track these systems around the clock. Scientists measure atmospheric rivers using two key metrics. The first is Integrated Water Vapor, or IWV. Picture a column of air stretching from the ground to the top of the atmosphere. IWV measures how much water is stacked up in that column. If you squeezed all the invisible vapor down to the ground, IWV tells you how deep the puddle would be. ARs are defined by IWV values above 2.0 centimeters. The second measurement is Integrated Vapor Transport, or IVT. IWV measures what is sitting there. IVT measures what is moving. It captures how much water vapor is flowing horizontally through the sky over time. For flood forecasters, IVT is the number that matters, the same way a river gauge matters more than a rain gauge when you are downstream of a dam.
How Atmospheric Rivers Work
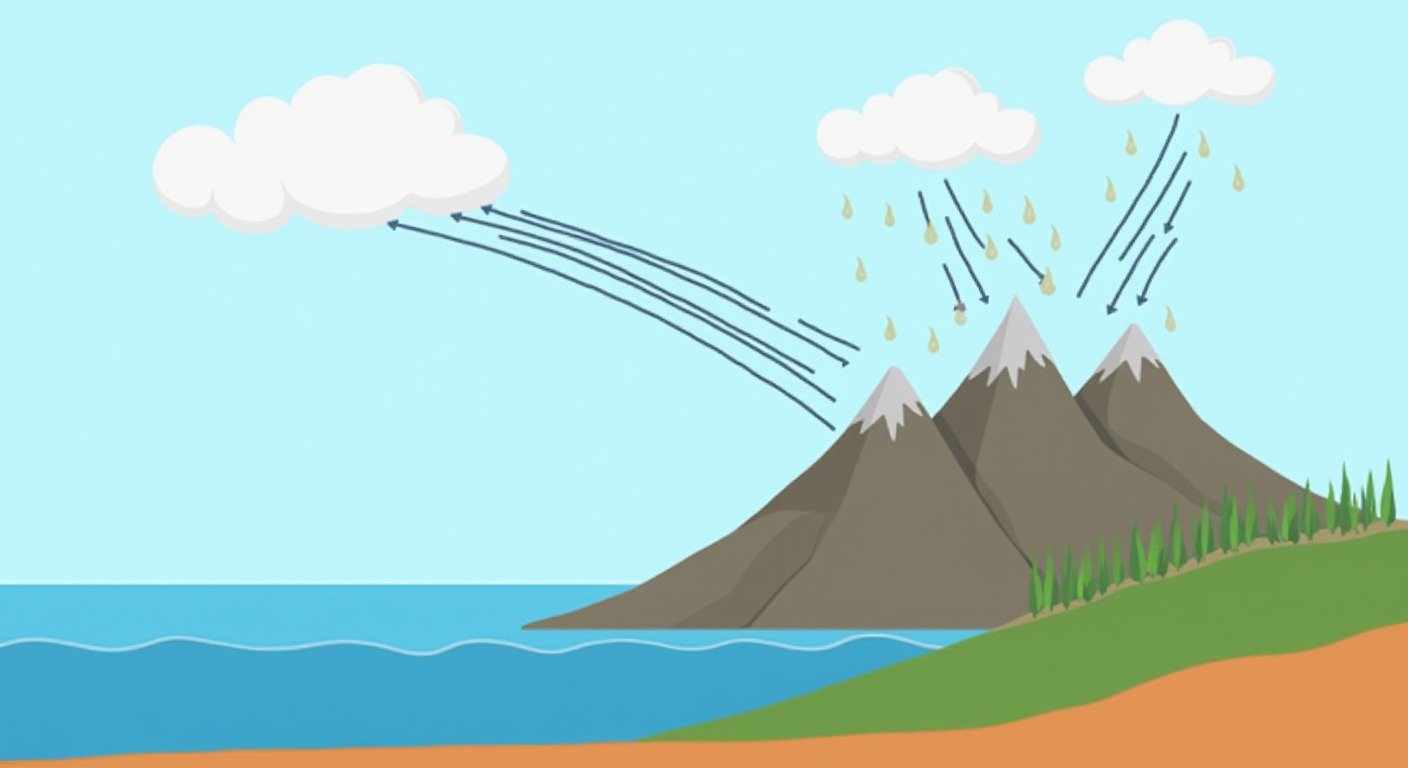
How atmospheric rivers work starts over warm tropical oceans. The sun heats the sea surface. Water evaporates. Winds gather that moisture into concentrated bands at roughly one to two kilometers above the ocean. The jet stream, which steers weather systems across the globe, then grabs these moisture bands and drives them toward coastlines where mountains do the rest. When the moisture-laden air hits a coastal range, it has nowhere to go but up. As it rises, it cools. Cooler air cannot hold as much water vapor, so the moisture condenses into clouds and falls as rain or snow. Meteorologists call this orographic precipitation. The mountains act like a squeegee, wringing the water out of the sky. This is why the western slopes of the Sierra Nevada and the Coast Ranges get hammered during AR events while inland areas stay dry. The mountains take everything. By the time the air reaches Nevada, it is spent. The same pattern plays out on every mid-latitude west coast on Earth, from California to Portugal, Chile, New Zealand, Iran, and western Australia. The global water cycle depends on these corridors. Atmospheric rivers contribute roughly 22 percent of total global runoff while covering a tiny fraction of the sky. The most famous type of AR has a name that sounds like a cocktail. Pineapple express weather refers to a specific atmospheric river that pulls warm, tropical moisture from the waters near Hawaii toward the US West Coast. Despite the name, it has nothing to do with fruit. It is a warm AR. Because the moisture originates in the tropics, Pineapple Express events produce rain at high elevations instead of snow. That rain falls on existing snowpack, creating dangerous rain-on-snow flood events. A Pineapple Express can melt a month of snow accumulation in 48 hours. Cold ARs form at higher latitudes and bring snow to the mountains instead of rain. They build the snowpack that 40 million people in the American West depend on for summer water. The type of AR that arrives determines whether you get a reservoir refill or a flood warning. Understanding how snow forms helps explain why cold ARs are the ones that build water security while warm ones threaten it.
The AR Scale: From Beneficial to Hazardous
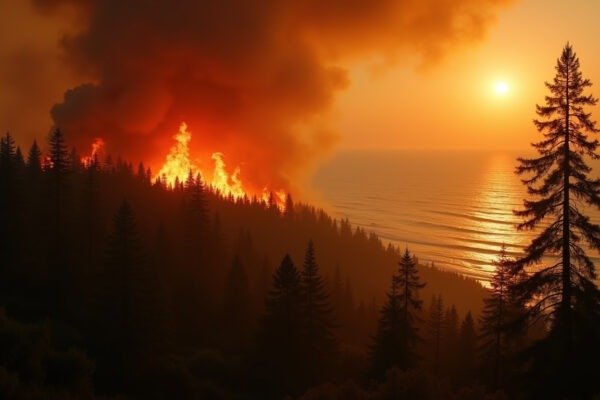
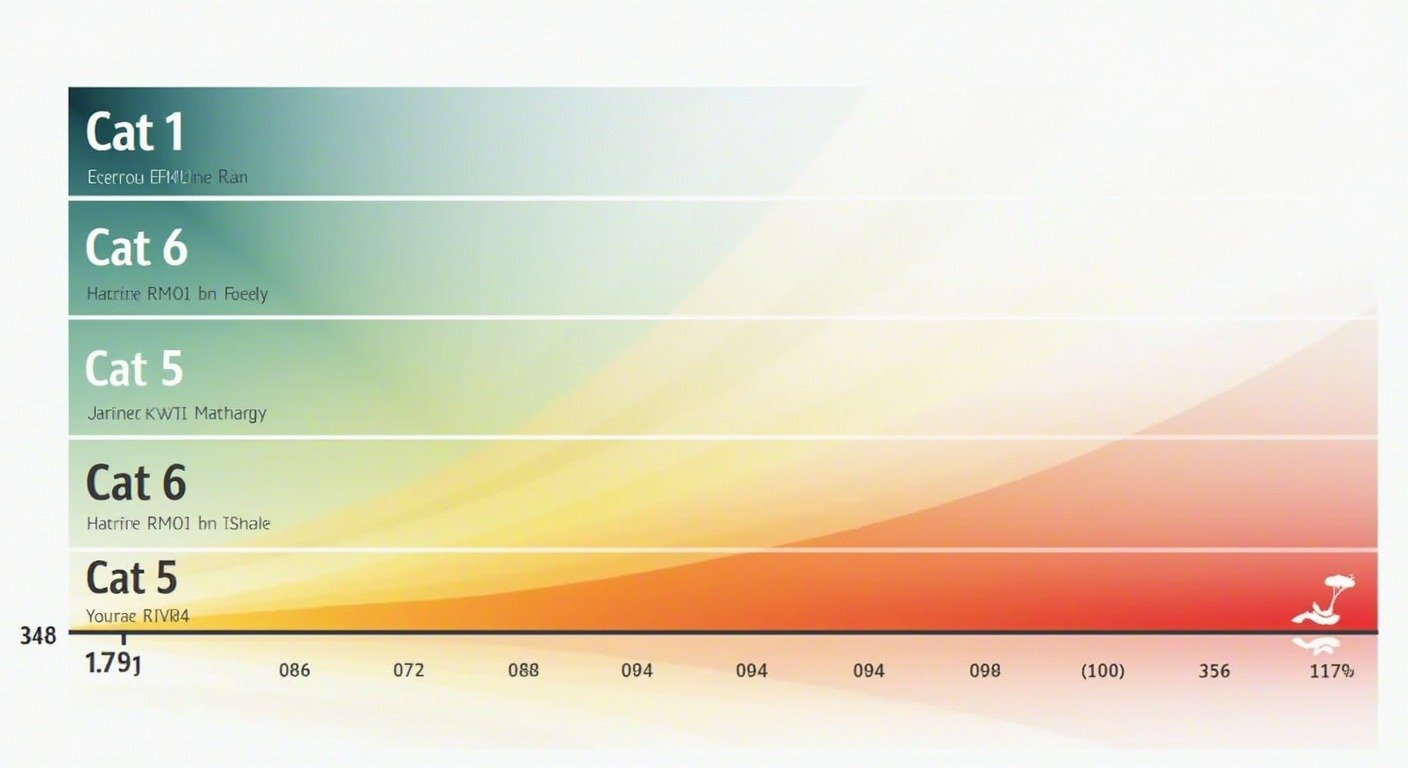
In 2019, researchers at Scripps released a five-category atmospheric river scale, similar to hurricane categories but for moisture rather than wind. It considers both the intensity of water vapor transport and how long the AR lingers. A Cat 3 that stays for 6 hours is very different from a Cat 3 that sits over your city for three days. Cat 1 and Cat 2 events are primarily beneficial. They bring welcome rain, refill reservoirs, and build snowpack without pushing rivers past their banks. Farmers in California’s Central Valley watch Cat 1 forecasts the way traders watch market reports. That rain is their irrigation budget for the season. Cat 3 events balance benefit and hazard. They deliver significant water but push some rivers to flood stage. Localized flooding is possible. Emergency managers start paying attention. Cat 4 and Cat 5 events are primarily hazardous. The New Year’s 1997 storm was a Cat 5. Over 100 hours of continuous moisture feed. More than a billion dollars in damage. Federal disaster declarations across dozens of counties. On the Oregon coast, a Cat 4 atmospheric river hits roughly once per year. In Southern California, a Cat 4 arrives about once a decade. When it does, neighborhoods built on burn scars from recent wildfires face the highest risk. Soil that has been baked by fire cannot absorb water. It repels it. Rainfall turns into instant runoff. Hillsides become mudslides.
Why Atmospheric Rivers Matter to You
Atmospheric river California impacts touch nearly every aspect of daily life in the state. Landfalling ARs account for 30 to 50 percent of California’s total annual precipitation and snowpack, according to the Fourth National Climate Assessment. That is the water in your tap. The irrigation for the almonds in your grocery store. The hydroelectric power keeping your lights on during a heat wave. When atmospheric rivers fail to show up, the effects ripple through every sector of the economy. The flip side is that ARs also cause the vast majority of flood damage on the West Coast. The same system that ends a drought can trigger a disaster. This is California’s water paradox. You cannot have water security without atmospheric rivers. You also cannot have flood safety without preparing for the strongest ones. The human impacts extend to health, homes, and the economy. When an AR triggers a mudslide in a burn scar area, families lose houses that have been in their names for generations. When reservoirs fill too fast, dam operators must release water they would rather store, trading flood safety today for water scarcity next summer. The absence of ARs is just as dangerous. Droughts in South Africa, Spain, and Portugal have been linked to years when atmospheric river activity was suppressed. These sky rivers are infrastructure. When they fail to arrive, entire regions feel it for years.
Climate Change and a Thirstier Sky
The physics is straightforward. Atmospheric rivers explained through the lens of climate science follow a simple rule. A warmer atmosphere holds more water vapor, roughly 7 percent more for every degree Celsius of warming. This means the ARs that do form can carry more moisture. The National Climate Assessment projects that landfalling atmospheric rivers on the US West Coast are likely to increase in frequency and severity as the climate warms. This does not mean more storms overall. It means the storms that arrive will be wetter. A Cat 3 in a warmer world may pack the punch of a Cat 4 in the old climate. At the same time, the dry stretches between AR events may grow longer. California’s climate has always swung between wet and dry. Climate change is widening the arc of that swing. The same year can bring a devastating flood in January and a record-breaking wildfire in September. Both extremes trace back to the same atmospheric mechanism, now supercharged by a warmer ocean and a thirstier sky. How rain forms inside these systems follows the same physics it always has. The difference now is volume. More moisture in the atmosphere means more rain from each storm. The National Weather Service can issue flood warnings for AR events five to seven days in advance. That lead time saves lives. It gives emergency managers a full work week to clear culverts, stage sandbags, and preposition rescue teams. It gives you time to check your flood zone and pack a go-bag if you live downhill from a burn scar.
What You Can Actually Do
Atmospheric rivers explained through the AR scale give you everything you need without a meteorology degree. When the NWS issues an Atmospheric River Watch, look for two numbers: the AR category and the duration. A Cat 2 that passes in 12 hours is a good rain. A Cat 4 that stalls for 48 hours is a problem. If you live in California, Oregon, or Washington, bookmark the CW3E AR forecast page. It updates daily during the wet season and gives you the category, duration, and landfall location for every approaching AR. The same way people in Florida check the hurricane cone, people on the West Coast can now check the AR scale. Atmospheric rivers explained in full come down to this: invisible rivers in the sky, born over warm oceans, steered by the jet stream, wrung out by mountains, delivering half your water and nearly all your flood risk. The word “river” is not a metaphor. These systems move more water than anything on the ground. Knowing their name, their category, and their schedule is as basic to living on the West Coast as knowing your tsunami zone.