1. Why Track Weather Patterns Yourself
Tracking weather yourself is not about replacing professional forecasts. It is about understanding them well enough to make better decisions. Learning hurricane tracking basics and how seasonal weather patterns work gives you context that headlines alone cannot provide.
When you know how to read a hurricane forecast cone, you understand why evacuating an entire coastline is rarely necessary, and why staying put can still be dangerous even when you are outside the cone. When you understand what the Niño-3.4 index is telling you, winter headlines about El Niño stop sounding like random warnings and start making practical sense.
Three things change when you learn to track weather yourself:
You plan better. Seasonal outlooks tell you whether to expect a wetter or drier winter months in advance. Farmers, water managers, and insurance companies already use this data. Homeowners and travelers can too.
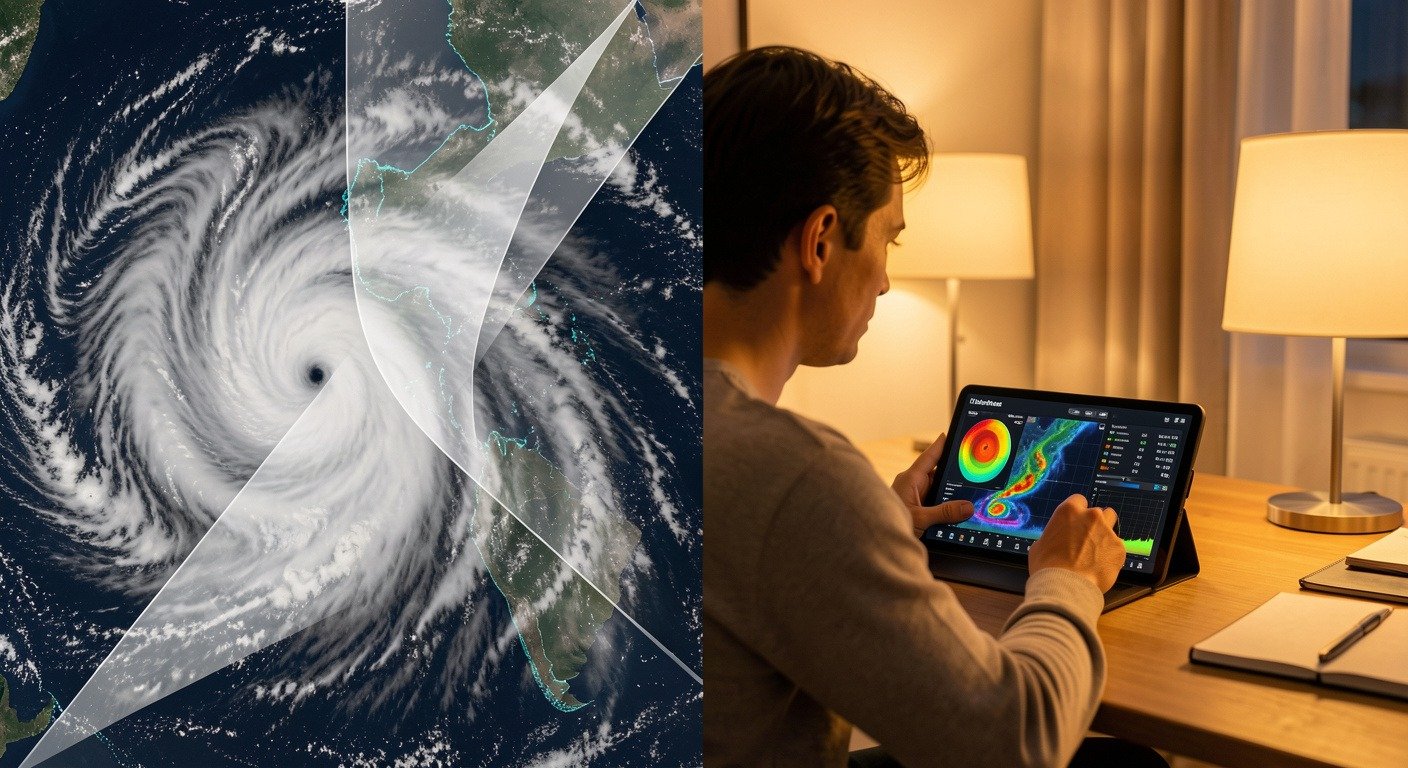
You prepare smarter. Hurricane tracking tools from the NHC show you exactly where a storm is, where it is headed, and how strong it is, updated every few hours. You can watch a storm evolve in near real time instead of waiting for the evening news.
You filter out the noise. Headlines often exaggerate. Understanding the actual data helps you separate what matters from what does not.
2. Hurricane Tracking: How to Use NHC Tools
The National Hurricane Center, part of NOAA, is the world’s authority on Atlantic and Eastern Pacific hurricanes. For anyone learning hurricane tracking, its website, nhc.noaa.gov, is the first place to go during the Atlantic season, which runs June 1 through November 30.
The Cone of Uncertainty
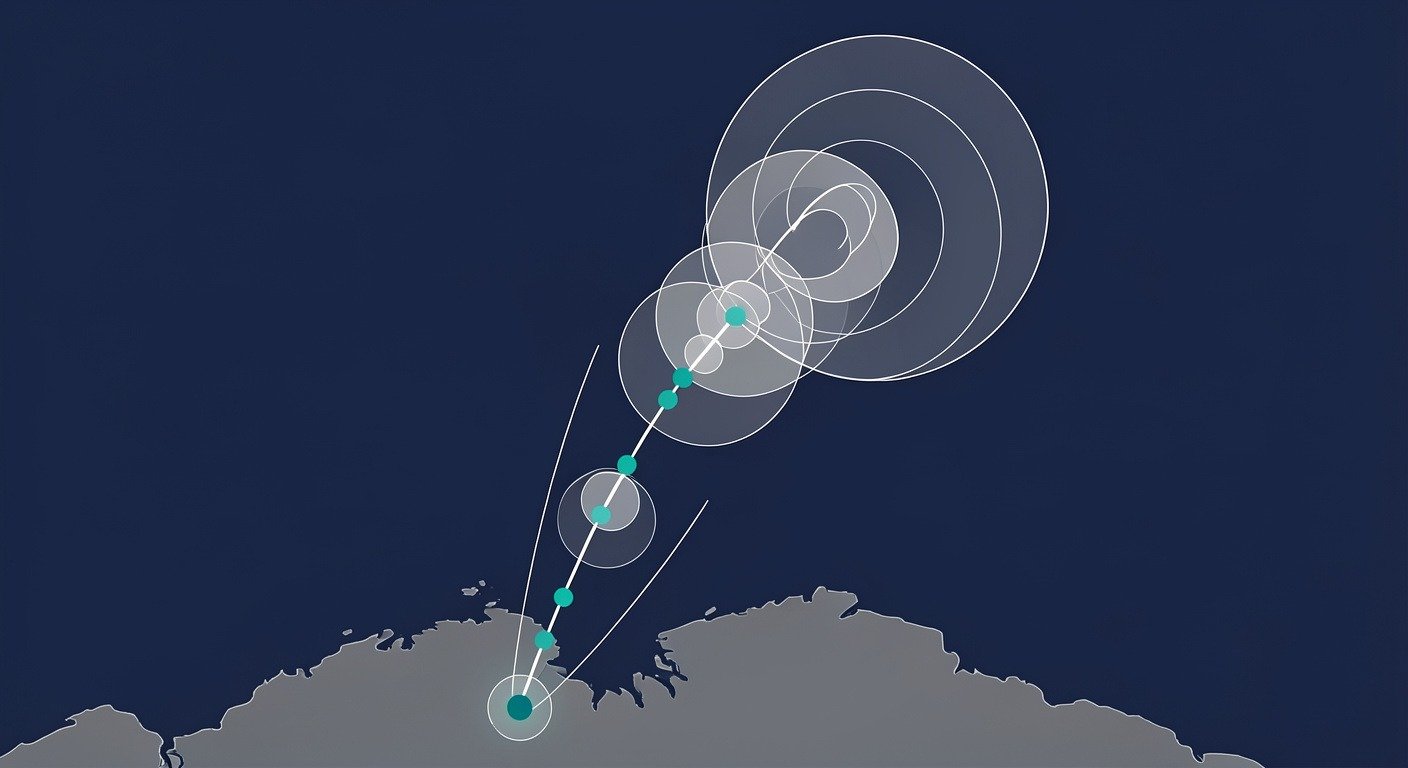
The most important thing to know about the NHC forecast cone, the central tool for hurricane tracking, is what it is not. It is not a cone of impact. It does not show where damage will occur.
In simple terms: The cone shows where the center of a hurricane is most likely to travel, based on how accurate past forecasts have been at each time range. The cone gets wider the further out you go because forecasts become less certain over time.
The professional term: This is the NHC Track Forecast Cone, a graphical representation of probable storm center track. The cone is formed by enclosing the area swept by a series of circles centered on the official forecast track at 12, 24, 36, 48, 60, 72, 96, and 120 hours. Each circle is sized so that roughly two-thirds of historical forecast errors fall inside it.
Real-world example: Think of a bowling ball rolling down a lane. At first you know roughly where it is headed. But the longer it rolls, the more it could drift left or right. The cone is like drawing the range of paths the ball could take, with two-thirds of historical bowling balls staying inside those lines.
For the 2026 Atlantic hurricane season, the NHC cone radii are:
| Forecast Period | Cone Radius |
|---|---|
| 12 hours | 25 nautical miles |
| 24 hours | 35 nautical miles |
| 36 hours | 45 nautical miles |
| 48 hours | 55 nautical miles |
| 60 hours | 65 nautical miles |
| 72 hours | 80 nautical miles |
| 96 hours | 120 nautical miles |
| 120 hours | 200 nautical miles |
According to the National Hurricane Center, tropical storm force winds, storm surge, and heavy rain can extend hundreds of miles from the storm’s center, well beyond the cone. [SOURCE: NHC, https://www.nhc.noaa.gov/aboutcone.shtml]
The critical message: If you are outside the cone, you are not necessarily safe. If you are inside the cone, you are not necessarily in danger. The cone only predicts where the storm’s eye will go, not where the storm’s impacts will be felt.
GOES Satellites: Watching From 22,000 Miles Up
In simple terms: Weather satellites called GOES sit in fixed positions 22,000 miles above Earth and take pictures every few minutes. They see clouds, measure temperatures, and track storm movement. When a storm is far out at sea, satellites are often the only way to watch it.
The professional term: Geostationary Operational Environmental Satellites, or GOES, are NOAA’s fleet of Earth-watching satellites in fixed positions above the equator. GOES-19 is the current GOES-East satellite, watching the Atlantic basin.
Real-world example: It is like having a security camera 22,000 miles above your house. It takes pictures and also reads cloud-top temperatures. Colder cloud tops mean stronger thunderstorms. The satellite also detects lightning. NHC forecasters watch these images in real time to see if a storm is strengthening or weakening. [SOURCE: NHC, https://www.nhc.noaa.gov/satellite.php]
Spaghetti Models and Hurricane Hunters
When you see “spaghetti models” during a hurricane event, these are multiple forecast model tracks plotted together. Each line represents what a different computer model predicts for the storm’s path. When the lines are tightly clustered, forecasters have high confidence. When they spread apart, uncertainty is higher.
The NHC runs models including the GFS (FV3), ECMWF, UKMET, HAFS-A, and HAFS-B, among others. [SOURCE: NHC, https://www.nhc.noaa.gov/modelsummary.shtml]
NOAA’s Hurricane Hunter aircraft fly directly into storms to collect data that satellites cannot get. They measure wind speeds, air pressure, and ocean temperatures from inside the storm. This reconnaissance data feeds directly into forecast models and often reveals whether a storm is rapidly intensifying, something satellites alone can miss. [SOURCE: NOAA, https://www.omao.noaa.gov/learn/aircraft-operations/about/hurricane-hunters]
Social Media Highlight
“The hurricane cone shows where the storm’s center will likely go, not where damage will happen. The storm’s impacts can extend hundreds of miles beyond the cone.”
3. Understanding El Niño and La Niña (The ENSO Cycle)
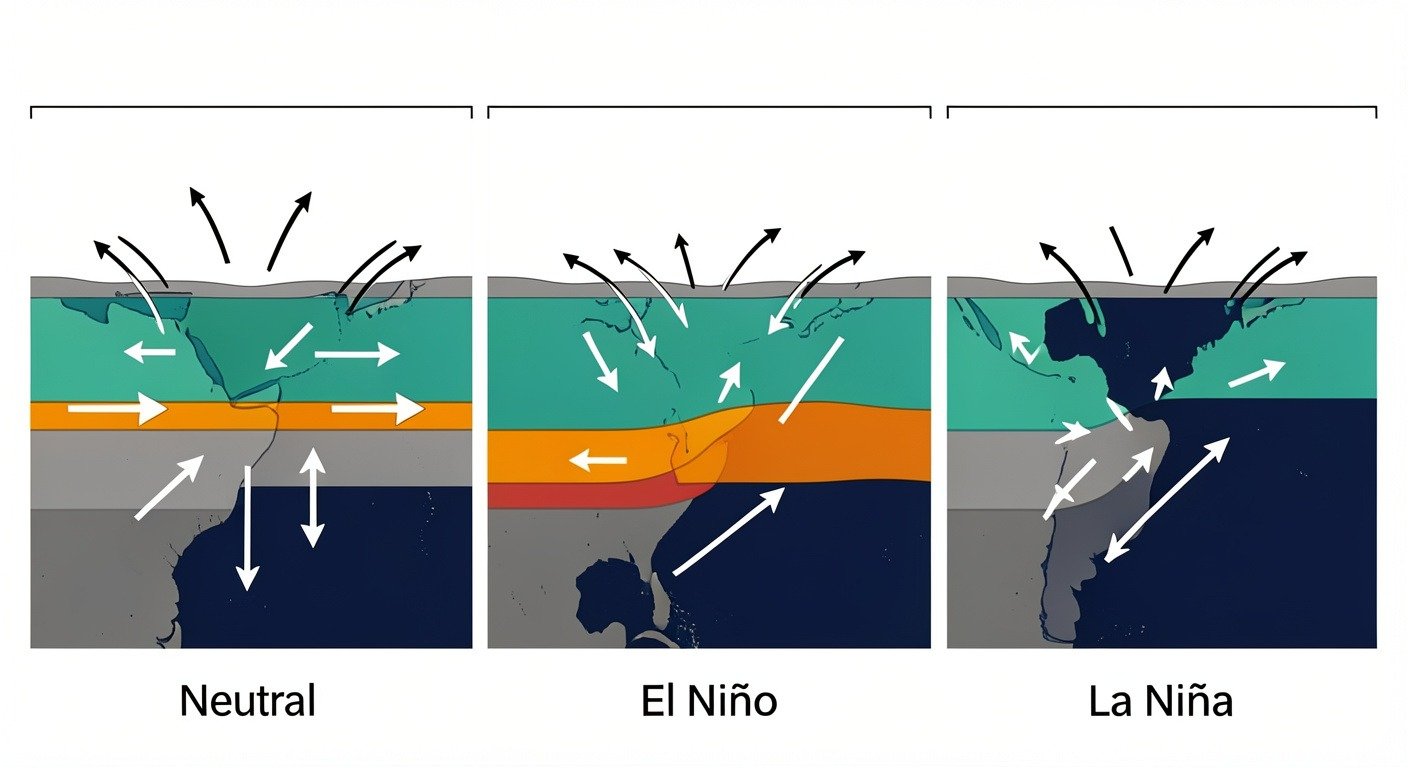
Every few years, the Pacific Ocean shifts between warmer and cooler phases. These shifts reorganize global weather patterns. The cycle is called the El Niño-Southern Oscillation, or ENSO.
How the Cycle Works
In simple terms: The Pacific Ocean has a natural cycle where it switches between warmer and cooler phases. Trade winds normally push warm surface water west toward Asia, while cold water rises from the deep ocean near South America to replace it. During El Niño, those winds weaken and warm water sloshes back east. During La Niña, the winds strengthen and push even more warm water west. These shifts in ocean temperature change where storms form and where rain falls around the world.
The professional term: The El Niño-Southern Oscillation (ENSO) is the natural climate cycle of shifting Pacific Ocean temperatures and atmospheric pressure patterns. Events occur every two to seven years and typically last nine to twelve months. El Niño occurs more frequently than La Niña.
Real-world example: Think of a bathtub with a fan blowing across the surface. Normally, the fan pushes warm water to one end. If the fan weakens, the warm water spreads back toward you. If the fan strengthens, more warm water piles up at the far end. Changing where the warm water sits changes the humidity and temperature patterns across the whole room, just like ENSO shifts global weather. [SOURCE: NOAA Ocean Service, https://oceanservice.noaa.gov/facts/ninonina.html]
El Niño vs. La Niña: What Each Phase Brings
| Factor | El Niño | La Niña |
|---|---|---|
| Trade winds | Weaken or reverse | Strengthen |
| Warm water location | Shifts east toward Americas | Pushed further west toward Asia |
| Jet stream | Shifts south over North America | Shifts north over North America |
| Southern US winter | Wetter than normal, cooler | Drier than normal, warmer |
| Northern US winter | Drier and warmer | Colder and wetter |
| Pacific Northwest | Drier than normal | Heavier rain and snow |
| Atlantic hurricane season | Suppressed (fewer storms) | More active (more storms) |
| Global temperature | Warmer global average | Cooler global average |
El Niño winter impacts and La Niña winter impacts are roughly mirror images of each other, but the exact outcomes depend on the strength of the event and other atmospheric patterns in play. No two ENSO events are identical.
[SOURCE: NOAA Ocean Service, https://oceanservice.noaa.gov/facts/ninonina.html; NOAA Climate.gov, https://www.climate.gov/news-features/blogs/enso/impacts-el-ni%C3%B1o-and-la-ni%C3%B1a-hurricane-season]
The Number Everyone Watches: The Niño-3.4 Index
In simple terms: Scientists monitor a specific rectangle of the Pacific Ocean roughly the size of the United States. When the water temperature in that box is at least 0.5°C above average for several months, it is El Niño. When it is at least 0.5°C below average, it is La Niña. This single number is the most watched climate metric on Earth.
The professional term: The Niño-3.4 Index is the sea surface temperature anomaly in the central equatorial Pacific, specifically the region bounded by 5°N to 5°S and 120°W to 170°W. It is the standard monitoring region for ENSO conditions.
Real-world example: It is like a doctor taking your temperature. If your temperature is 98.6°F (37°C), you are normal. Above 99.5°F and you have a fever. Below 97.5°F and you have hypothermia. The Niño-3.4 index is the Pacific Ocean’s temperature check. Right now, as of June 2026, it reads +0.7°C. The Pacific has an El Niño “fever.” [SOURCE: CPC ENSO Diagnostic Discussion, https://www.cpc.ncep.noaa.gov/products/analysis_monitoring/enso_advisory/ensodisc.shtml]
Social Media Highlight
“Right now, the Pacific Ocean has an El Niño ‘fever.’ The Niño-3.4 index reads +0.7°C above normal, and forecasters give a 63% chance this becomes one of the strongest El Niño events on record.”
4. How Seasonal Forecasts Work
Seasonal forecasts operate differently from daily weather forecasts. They do not predict what will happen on a specific day months from now. They tell you which way the odds are leaning.
In simple terms: Seasonal forecasts do not predict specific days. They tell you the odds. Instead of saying “it will rain on December 15th,” they say “this winter has a 60% chance of being warmer than normal.” Meteorologists run computer models that simulate the atmosphere months into the future, then compare the results to historical averages to see which way things are leaning.
The professional term: A Probabilistic Seasonal Outlook is a forecast that gives percentage chances for above-normal, near-normal, or below-normal conditions over a three-month period. NOAA’s Climate Prediction Center (CPC) issues official 90-day outlooks near the middle of each month at 8:30 a.m. Eastern Time.
Real-world example: It is like a weather-savvy farmer who looks at soil moisture, ocean temperatures, and wind patterns in October and says “I think there is about a 60% chance this winter will be drier than usual.” They are reading the bigger signals that tilt the odds, not predicting specific rain events. [SOURCE: CPC, https://www.cpc.ncep.noaa.gov/products/predictions/long_range/seasonal.php?lead=1; NWS, https://www.weather.gov/about/forecast-process]
What the Percentages Actually Mean
When NOAA says there is a “40% chance of above-normal temperatures” for your region this winter, here is what that means:
A normal winter, by definition, has a 33% chance of being above-normal, a 33% chance of being near-normal, and a 33% chance of being below-normal. Those are the baseline odds, like rolling a three-sided die. When forecasters see signals like a developing El Niño, those odds shift. A 40% chance of above-normal means the odds have tilted from 33% to 40%. It is not a promise. It is a shift in probability.
According to the National Weather Service, forecast uncertainty increases at longer time ranges because the atmosphere is a chaotic system. Small changes in initial conditions can produce large differences in outcomes weeks or months later. Human forecasters remain vital for communicating this uncertainty and interpreting disagreements between computer models. [SOURCE: NWS, https://www.weather.gov/about/forecast-process]
The CPC uses multiple forecast tools: Canonical Correlation Analysis (CCA), Ensemble Canonical Correlation Analysis (ECCA), Optimal Climate Normals (OCN), the Climate Forecast System (CFS), and Stepwise Multiple Linear Regression (SMLR), among others. These are combined and reviewed by human forecasters before being issued as official outlooks. [SOURCE: CPC, https://www.cpc.ncep.noaa.gov/products/predictions/long_range/seasonal.php?lead=1]
5. What to Watch For: Winter 2026-2027
As of June 11, 2026, the Climate Prediction Center issued an El Niño Advisory. El Niño conditions are present and expected to strengthen into the Northern Hemisphere winter of 2026-2027. The developing El Niño 2026 2027 winter event is being closely watched because of its potential to rank among the strongest on record. Forecasters are watching whether this El Nino 2026 2027 winter reaches the very strong category, which would have significant El Niño winter impacts for communities across the country.
Here is what the data shows:
- The Niño-3.4 index, the key monitoring region in the central equatorial Pacific, reads +0.7°C. That is above the +0.5°C threshold that defines El Niño conditions.
- The Niño-1+2 index, which measures the easternmost Pacific waters closest to South America, reads +2.1°C. That is significantly warm.
- The CPC gives a 63% chance of a very strong El Niño developing during the November 2026 through January 2027 period.
- If it reaches that level, this El Niño would rank among the largest events since 1950.
[SOURCE: CPC ENSO Diagnostic Discussion, June 11, 2026, https://www.cpc.ncep.noaa.gov/products/analysis_monitoring/enso_advisory/ensodisc.shtml]
What a Strong El Niño Winter Typically Means
El Niño winter impacts follow patterns that have been observed across decades of events. Here is what a strong El Niño typically brings to different US regions:
Southern United States: Wetter than normal conditions are more likely across the Gulf Coast, Florida, and into the Southwest. This can mean beneficial drought relief or, in strong events, flooding and mudslides.
Northern United States and Canada: Drier and warmer conditions are more likely from the Pacific Northwest through the northern Plains and into the Great Lakes region. Snowpack in the northern Rockies and Upper Midwest often runs below normal during El Niño winters.
California: El Niño winters historically tilt toward wetter conditions for California, particularly in strong events, though this is not guaranteed.
Atlantic hurricane season: During El Niño, Atlantic hurricane activity is often suppressed because increased wind shear tears storms apart. During La Niña, hurricane seasons tend to be more active. This is why La Niña winter impacts include not just seasonal weather shifts but also the potential for a busier hurricane season the following summer. When headlines ask about La Niña this winter, they are usually pointing toward a more active Atlantic hurricane outlook and drier southern conditions. [SOURCE: NOAA Climate.gov, https://www.climate.gov/news-features/blogs/enso/impacts-el-ni%C3%B1o-and-la-ni%C3%B1a-hurricane-season]
The next CPC ENSO update is scheduled for July 9, 2026. Conditions can change, and ENSO forecasts carry uncertainty. The 63% chance of a very strong event means there is a 37% chance it does not reach that level. The best approach is to check the CPC website for the latest ENSO Diagnostic Discussion, issued monthly, and adjust your expectations as the data evolves.
Social Media Highlight
“Seasonal forecasts are not crystal balls. They are probability calculators. When NOAA says ‘40% chance of above-normal rain,’ they are telling you the odds have shifted, not promising a wet winter.”
6. Best Free Weather Tracking Tools
All of the tools described in this guide are free, public, and maintained by the United States government. For hurricane tracking and seasonal monitoring, here is a quick reference:
National Hurricane Center (nhc.noaa.gov): Tropical weather outlooks, storm advisories, forecast cone graphics, satellite imagery, radar loops, blank tracking maps, and GIS data. Updated every few hours during active storms. Print a blank tracking chart before hurricane season so you can plot a storm’s position by hand as advisories are issued.
Climate Prediction Center (cpc.ncep.noaa.gov): ENSO Diagnostic Discussions, Niño index charts, seasonal temperature and precipitation outlooks, monthly outlooks, and expert-written discussions. The ENSO page updates weekly with subsurface ocean temperatures, wind anomalies, and model forecasts.
Weather.gov: Local forecasts, radar, severe weather alerts, hurricane preparedness information, and forecast discussions written by local NWS forecast offices. The forecast discussion explains the reasoning behind the forecast, which teaches you how meteorologists think.
NOAA Climate.gov ENSO Blog (climate.gov/enso): Expert-written, accessible explanations of current ENSO conditions. Updated whenever significant changes occur. This is the best place to learn ENSO science in plain language.
NHC Satellite Page (nhc.noaa.gov/satellite.php): Real-time GOES-East satellite imagery with multiple bands. Watch storms form and move in near real time.
What This All Means for You
Weather tracking is a skill that builds on itself. Start with one tool. When a hurricane forms, open the NHC website and watch the cone update. When winter approaches, check the CPC ENSO page and look at the Niño-3.4 number. Over time, you will notice patterns and connections you never saw before.
You do not need to become a meteorologist. You just need to know that the data is public, the tools are free, and the signals are there for anyone willing to learn how to read them.
The winter of 2026-2027 is shaping up to be an important test of that skill. A strong El Niño is building in the Pacific. The data is clear, the tools are open, and the story is just beginning.
Frequently Asked Questions
What is the difference between a hurricane watch and a hurricane warning?
A hurricane watch means hurricane conditions are possible within 48 hours. A hurricane warning means hurricane conditions are expected within 36 hours. Watches tell you to prepare. Warnings tell you to act.
How accurate are hurricane forecasts?
The average NHC track forecast error has decreased significantly over the past two decades. The five-day track forecast is now roughly as accurate as the three-day forecast was in the early 2000s. However, intensity forecasts remain more challenging. Rapid intensification, where a storm’s winds increase by 35 mph or more in 24 hours, is particularly difficult to predict.
Can El Niño guarantee a mild winter for the North?
No. El Niño tilts the odds, but it does not guarantee anything. The 2015-2016 super El Niño brought a record-warm December to the eastern US, followed by a major January blizzard. ENSO is the strongest seasonal signal, but it is not the only one.
Where can I find hurricane tracking information for my phone?
The NHC website is mobile-friendly and provides full hurricane tracking capabilities. NOAA also maintains mobile-friendly versions of its radar and satellite pages. For push alerts, the FEMA app and your local National Weather Service office’s social media accounts are reliable free options.
How often does the ENSO cycle switch phases?
The full ENSO cycle, from El Niño through neutral to La Niña and back, is irregular. Events occur every 2 to 7 years. Some decades are dominated by one phase. El Niño occurs somewhat more frequently than La Niña.
Sources Used
- National Hurricane Center: Cone of Uncertainty Definition
- National Hurricane Center: Forecast Models Summary
- National Hurricane Center: Satellite Imagery
- NOAA Ocean Service: What Are El Niño and La Niña?
- Climate Prediction Center: ENSO Diagnostic Discussion, June 11, 2026
- Climate Prediction Center: Seasonal Outlooks
- National Weather Service: Forecast Process
- NOAA Climate.gov: ENSO Blog
- NOAA Climate.gov: Impacts of El Niño and La Niña on Hurricane Season
- NOAA: Hurricane Hunters Aircraft Operations