By Nature Weather Hub | April 2025 | Spotlight Explainer
🌍 When the Sky Turns Into a Lid
It starts quietly. No thunder, no storm. Just a stillness that feels unnatural. The air thickens. Shade offers no relief. Roads begin to shimmer. Cities swelter. People faint. Grids strain. And then the headlines appear:
“Record Temperatures Blanket the Continent.”
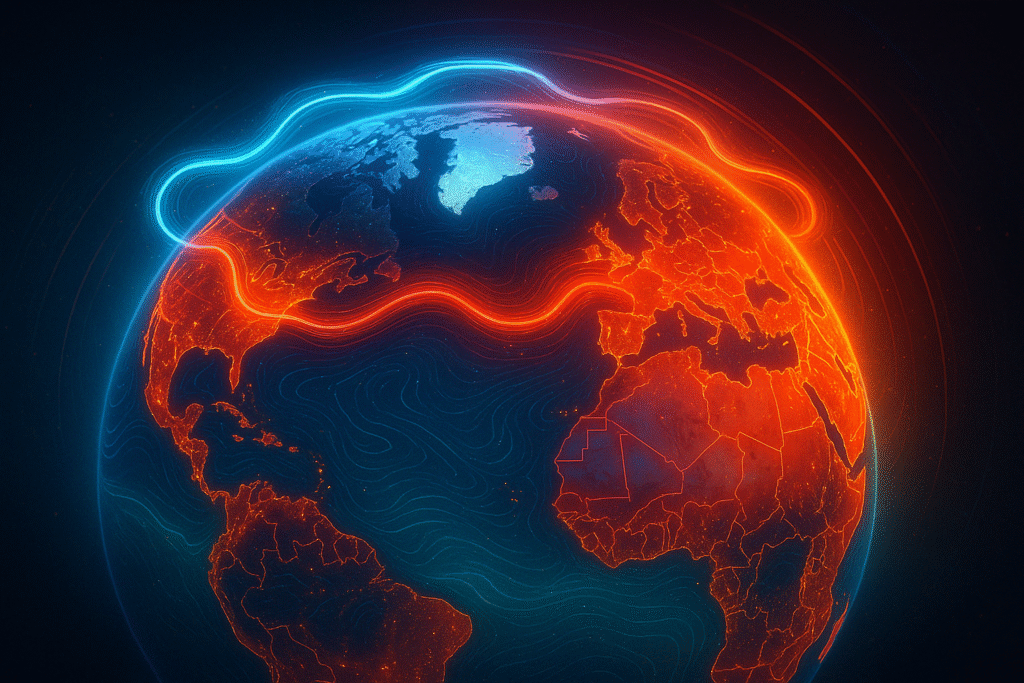
At the heart of it all? A phenomenon known as a heat dome — a meteorological force growing more frequent, more intense, and more dangerous in a warming world.
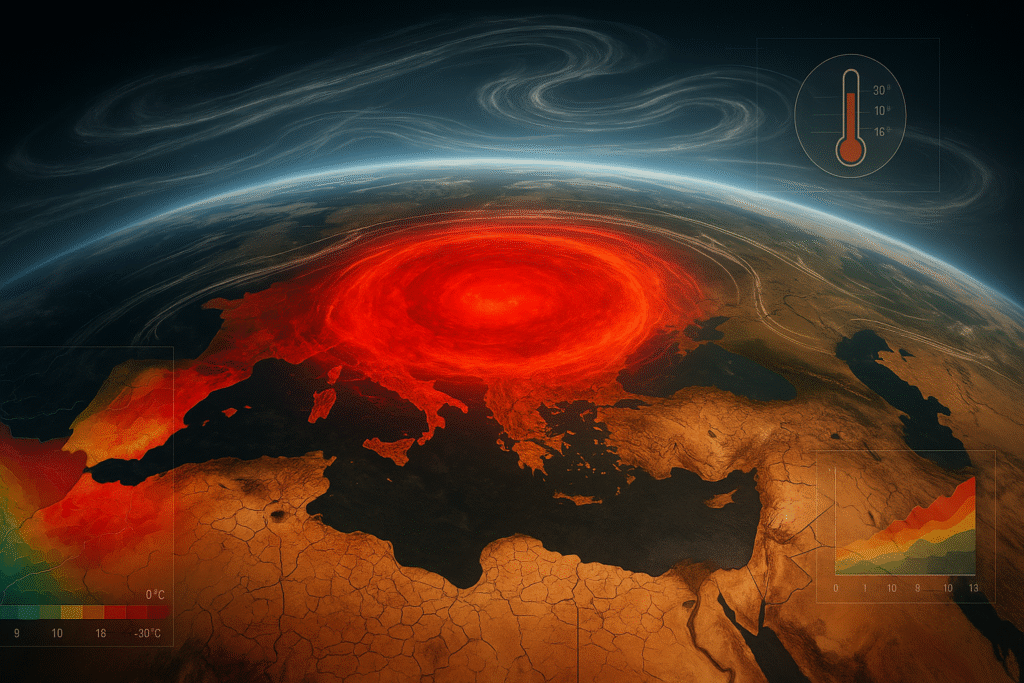
🔍 What Exactly Is a Heat Dome?
A heat dome forms when a stagnant high-pressure system parks itself over a region, acting like a giant lid that traps hot air beneath it. The result? Days or even weeks of oppressive, unrelenting heat.
Here’s how it works:
Sun heats the Earth’s surface.
Warm air rises, but high pressure above forces it back down.
That air compresses and heats up further.
Little to no wind or cloud cover allows temperatures to skyrocket.
Think of it as the atmosphere’s pressure cooker — only the contents are entire cities, ecosystems, and millions of people.
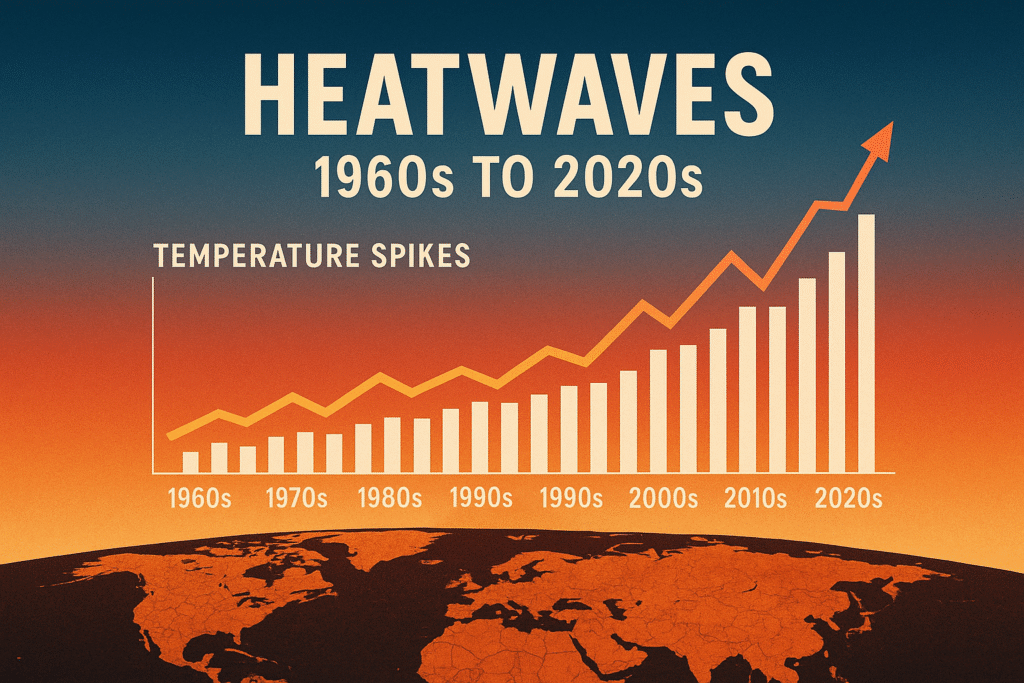
📈 The Rise of Heat Domes: From Rare to Regular
Heat domes were once rare. Now they’re a recurring feature of summer weather across the globe.
According to EPA climate indicators and NASA satellite data, here’s how heat events have evolved:
Decade
Avg. Heatwaves/Year
Avg. Duration (Days)
Avg. Intensity (°F Above Normal)
1960s
2
3
2.0°F
1980s
3
4
2.3°F
2000s
5
5
2.7°F
2020s
6
6
3.1°F
📊 EPA & NOAA Data. Last updated: March 2025
The pattern is clear: more heatwaves, lasting longer, with higher temperatures.
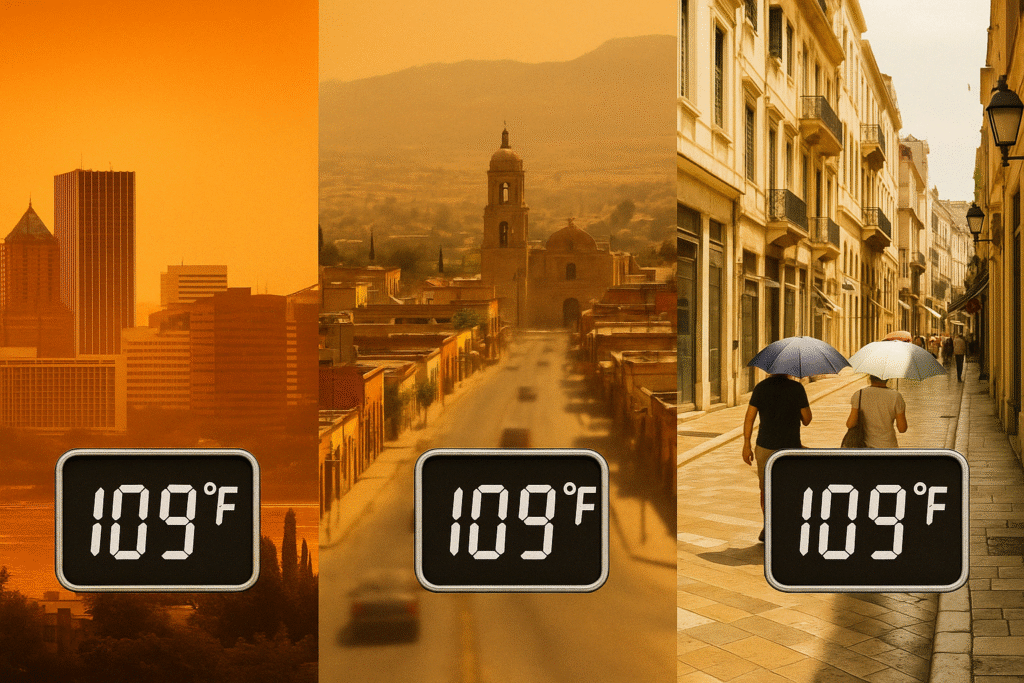
📍 Global Case Studies: When the Dome Strikes
🇺🇸 United States – Pacific Northwest (2021)
Portland, OR hit 116°F (46.7°C) — a historic all-time high.
Emergency services reported a tripling of 911 calls.
Over 600 heat-related deaths were reported across Oregon, Washington, and British Columbia.
🇲🇽 Mexico (2024)
Cities like Hermosillo reached 52°C (125.6°F).
Drought worsened, power grids failed, and agricultural zones lost over 40% of their yields.
🇪🇺 Europe (2024–25)
Cyprus recorded 116.2°F (46.8°C) during a July dome.
Wildfires scorched Greece and Italy, while elderly populations faced emergency evacuations.
These weren’t isolated flukes — they were climate-linked dominoes, falling in sync.
🔥 Health Consequences: The Silent Killers
Unlike hurricanes or floods, heatwaves often arrive quietly — and leave behind staggering death tolls.
Heatstroke: core body temperature surpasses 104°F
Dehydration: exacerbates chronic illness
Air Quality: worsens asthma and heart disease due to smog buildup under stagnant domes
According to the World Health Organization, heatwaves now kill five times more people globally than hurricanes and floods combined.
🧠 Most vulnerable: elderly, children, outdoor laborers, and urban dwellers.
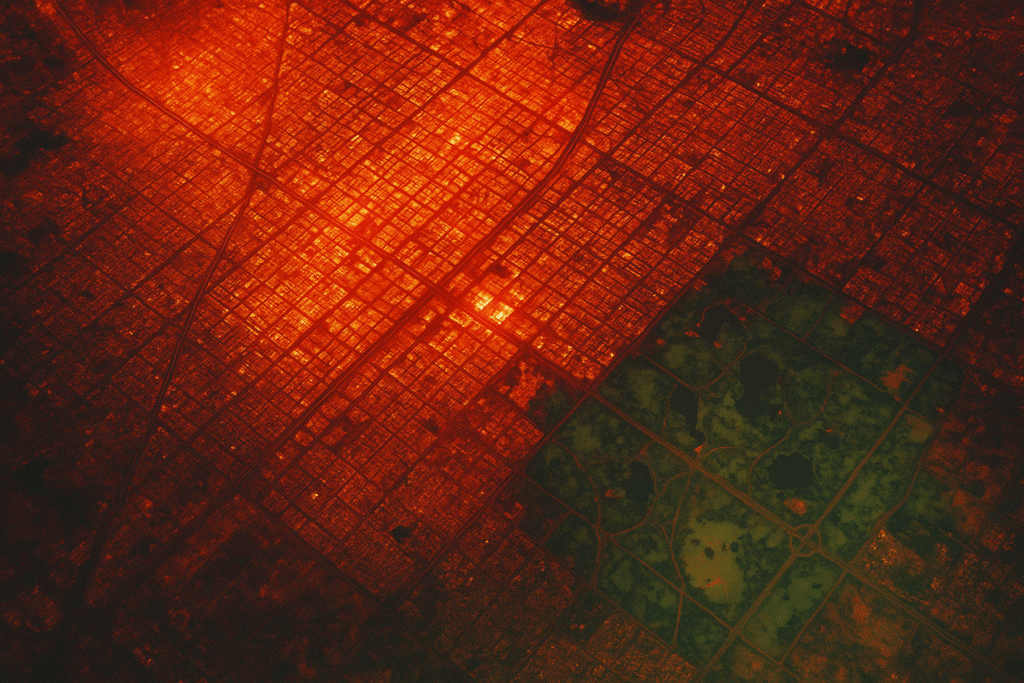
🏙️ Cities in the Crossfire: Urban Heat Islands
Urban areas make heat domes even worse.
Dark surfaces like asphalt and rooftops absorb more heat. Fewer trees and poor airflow trap warmth. This creates urban heat islands, where city centers are up to 7°F hotter than surrounding rural areas.
A study by Climate Central found that in cities like Phoenix, Delhi, and Cairo:
Nighttime temperatures don’t drop enough to allow recovery.
Energy demand for air conditioning spikes by over 30%.
Infrastructure failures (e.g., blackouts, rail buckling) become likely within 72 hours of dome onset.
🔮 What’s Fueling the Surge?
Heat domes are linked to climate change, but the mechanics involve shifting global systems:
Arctic Amplification: As polar ice melts, jet stream patterns weaken, making it easier for high-pressure ridges to stall.
Ocean Warming: Warmer oceans fuel moisture and heat in the lower atmosphere.
El Niño Effects: Intensify regional pressure systems that cause domes to linger.
🔁 Translation: More stalled weather. More domes. More danger.
📌 Real-Time Data Snapshot (April 2025)
Location
Temp
Heat Dome Duration
Power Outages
Phoenix, AZ
115°F
8 days
75,000 homes
New Delhi, India
114°F
5 days
Rolling blackouts
Córdoba, Argentina
110°F
6 days
Grid stabilized
📍 Source: NOAA, India Meteorological Department, LatinClima
🛡️ How Can We Prepare?
✅ Infrastructure
Build heat-resistant roads and rails
Upgrade power grids for peak loads
Design green buildings with natural airflow
✅ Policy
Implement national heat action plans
Mandate cooling centers in cities
Subsidize early warning systems
✅ Community
Distribute cooling kits to at-risk populations
Promote shade canopy planting
Launch public heat safety campaigns
Proactive steps today mean fewer deaths, less damage, and stronger cities tomorrow.
📣 Final Word: The Sky Isn’t Falling — It’s Sinking
A heat dome isn’t visible like a storm cloud. It doesn’t roar in like a hurricane. But it may be the deadliest natural phenomenon of our time — and one we’re only beginning to understand.
As the planet warms, expect more of them. Bigger. Longer. Hotter.
Knowing is surviving. That’s why Nature Weather Hub tracks every event — to keep you one step ahead of the rising heat.
🔔 Get daily disaster alerts and weather intelligence at NatureWeatherHub.com 📲 Follow us @NatureWeatherHub for global weather updates